The door-level record of who builds it right.
Every verified door is structured ground truth — pass or fail, by trade, by crew, by floorplan, compounding with every turn.
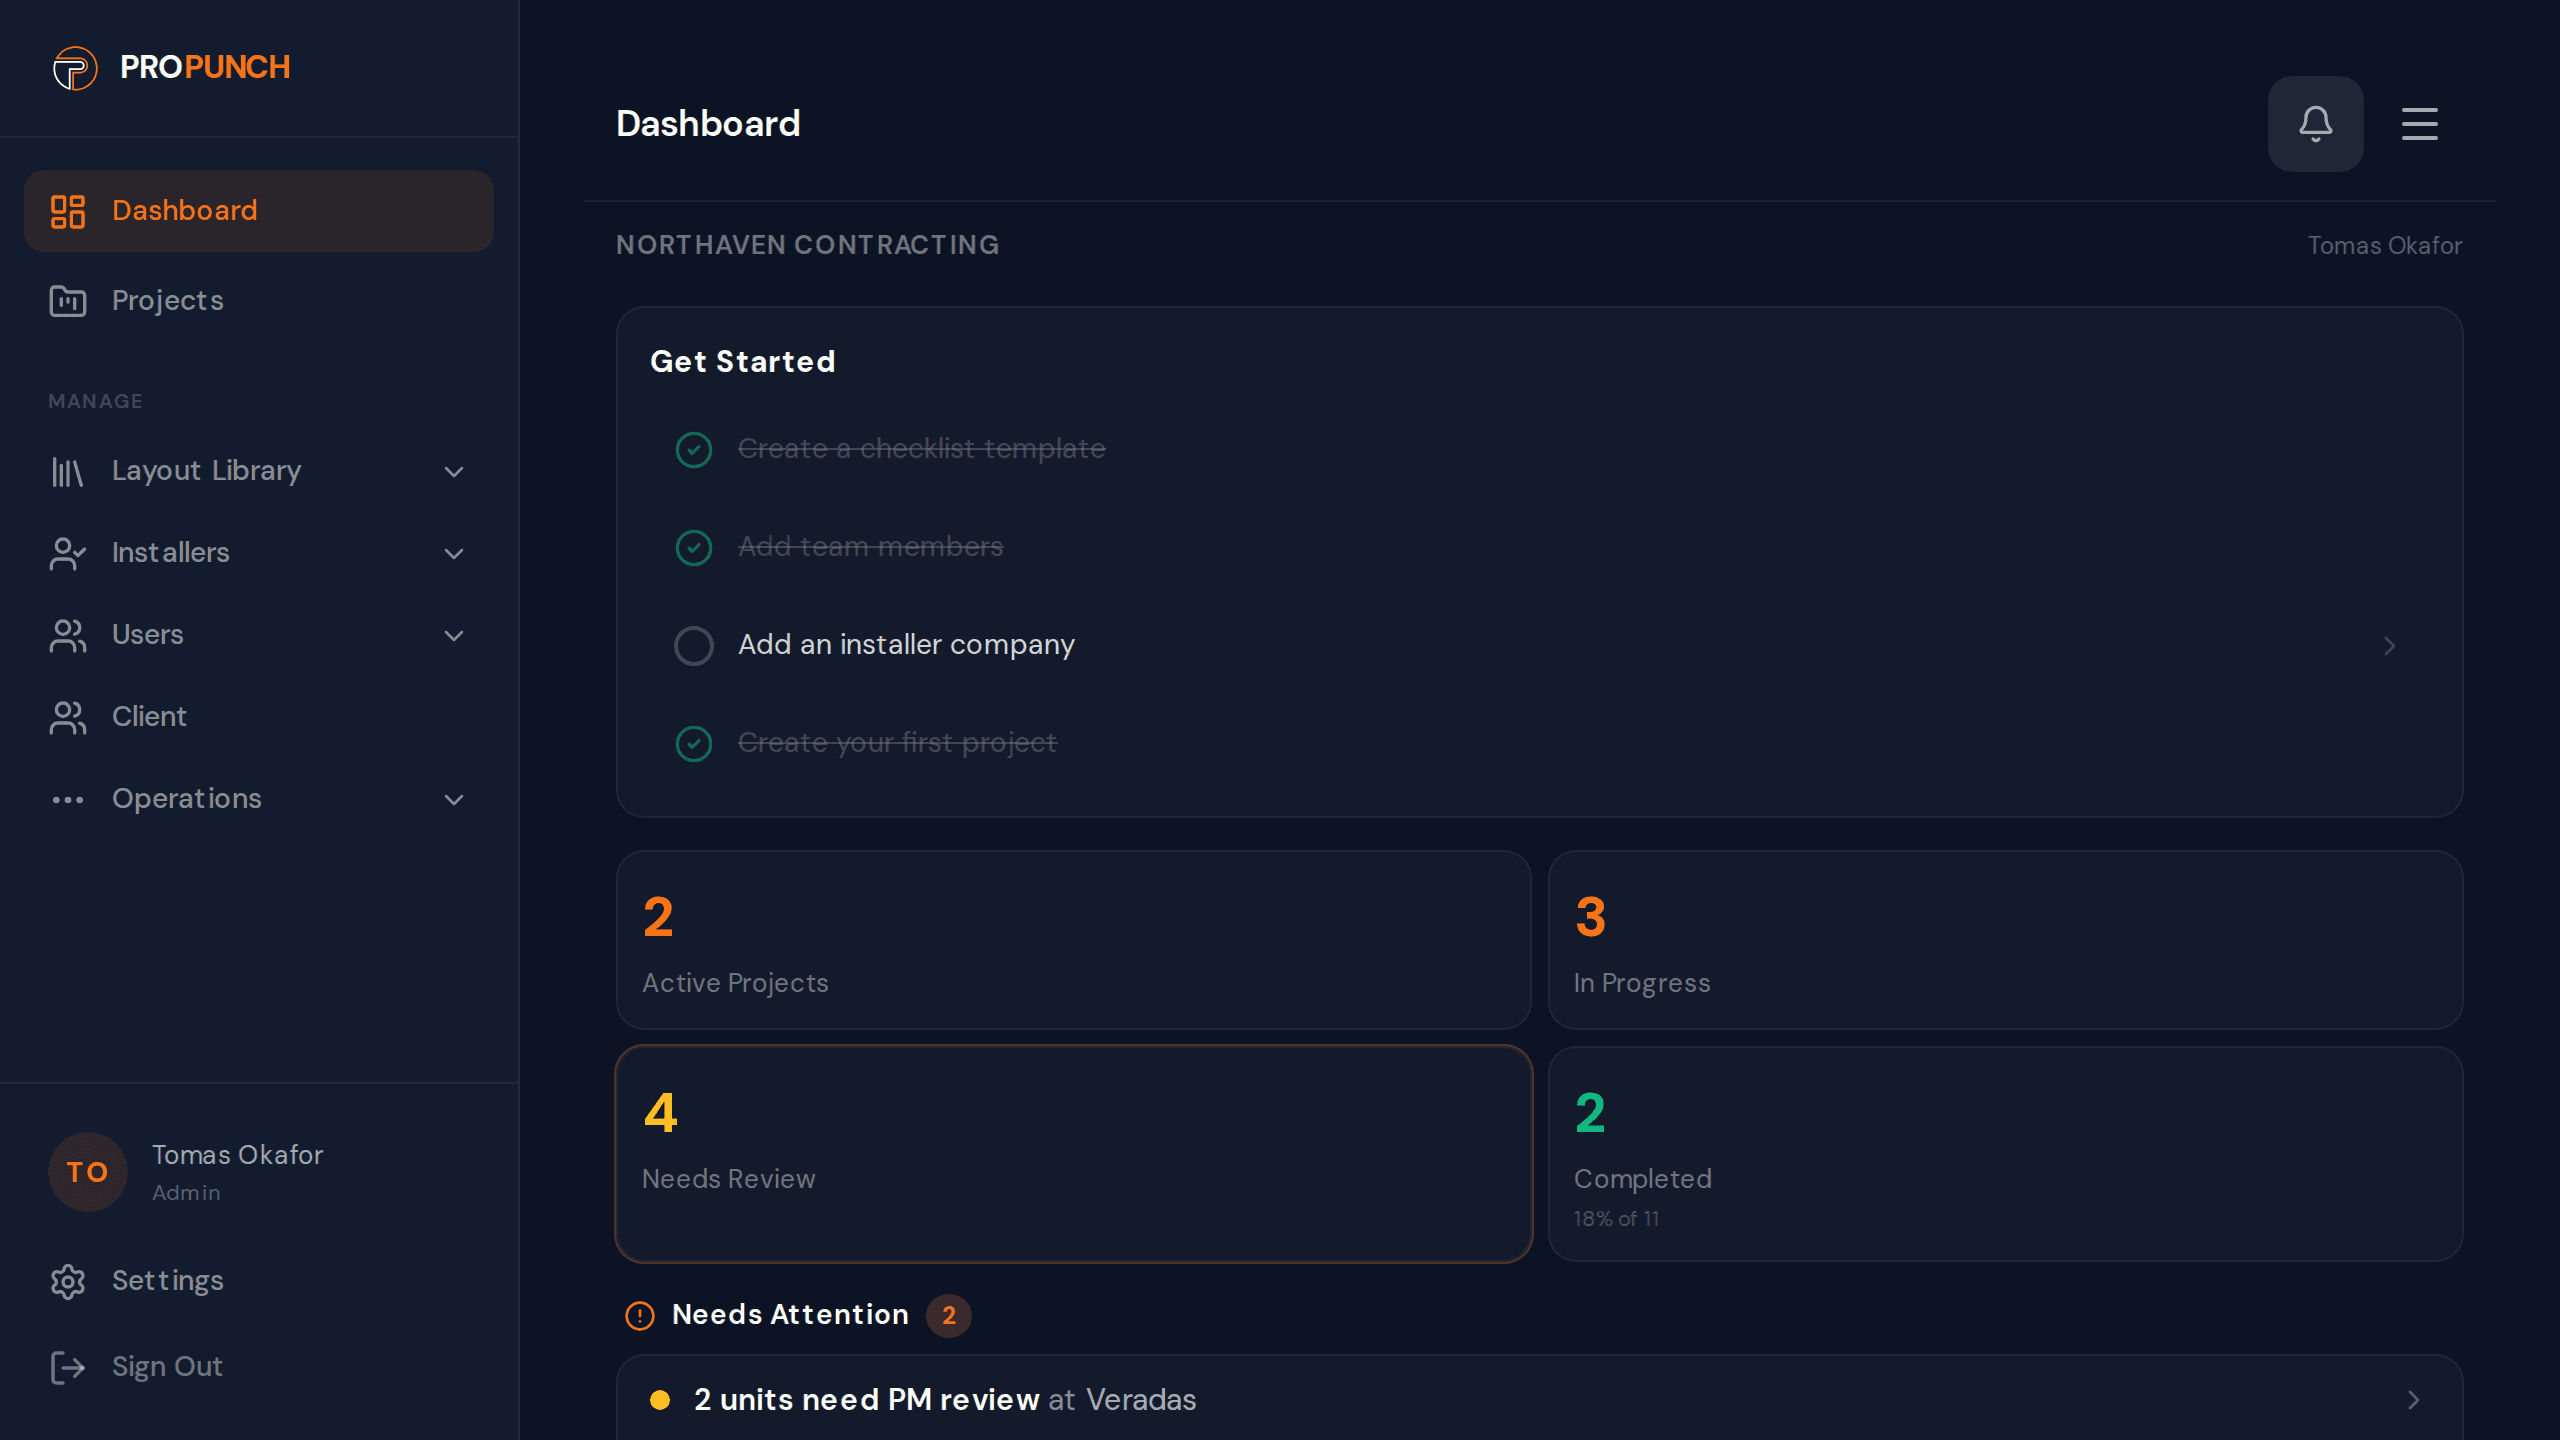
Know exactly how everyone performs.
First-pass rates and cycle times for every installer, subcontractor, and PM — built from the same verdicts your crews already record. Spot who’s slowing jobs down or running high fail rates, and get a weekly and finished-project report to plan the next job leaner.
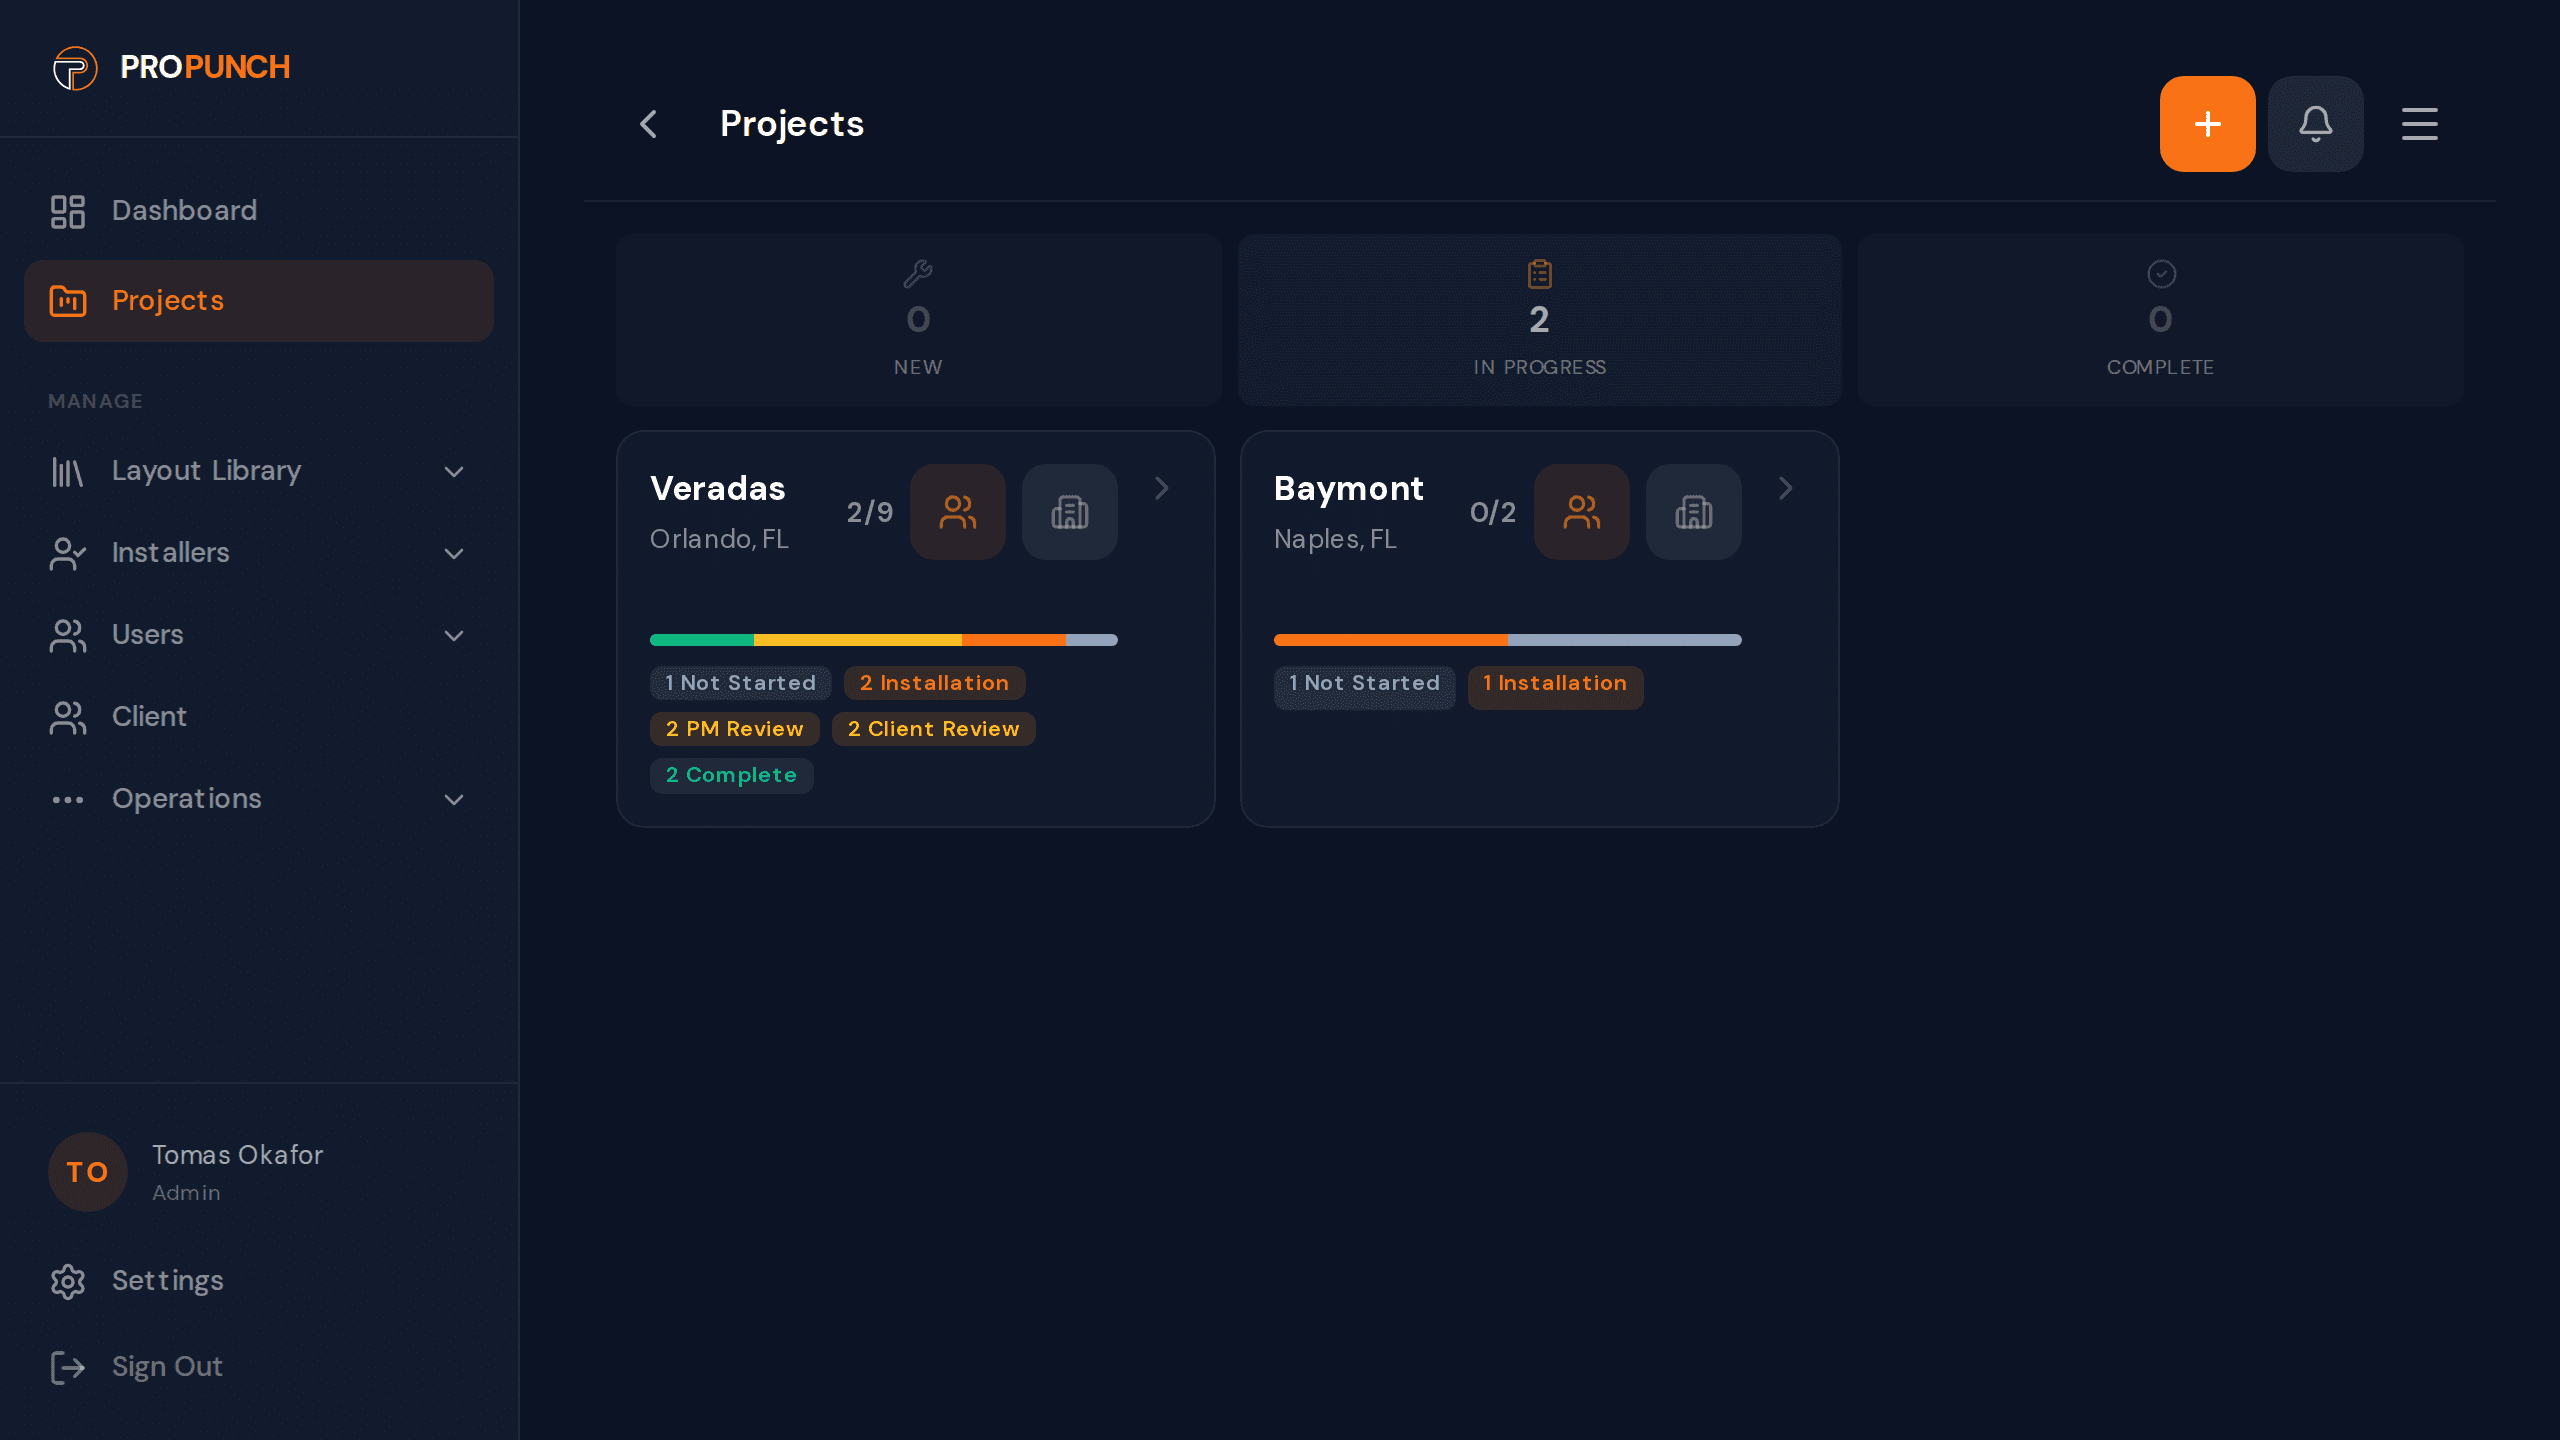
Project Progress
Unit completion rates across every project. How many units are not-started, in-progress, in review, complete — at a glance.
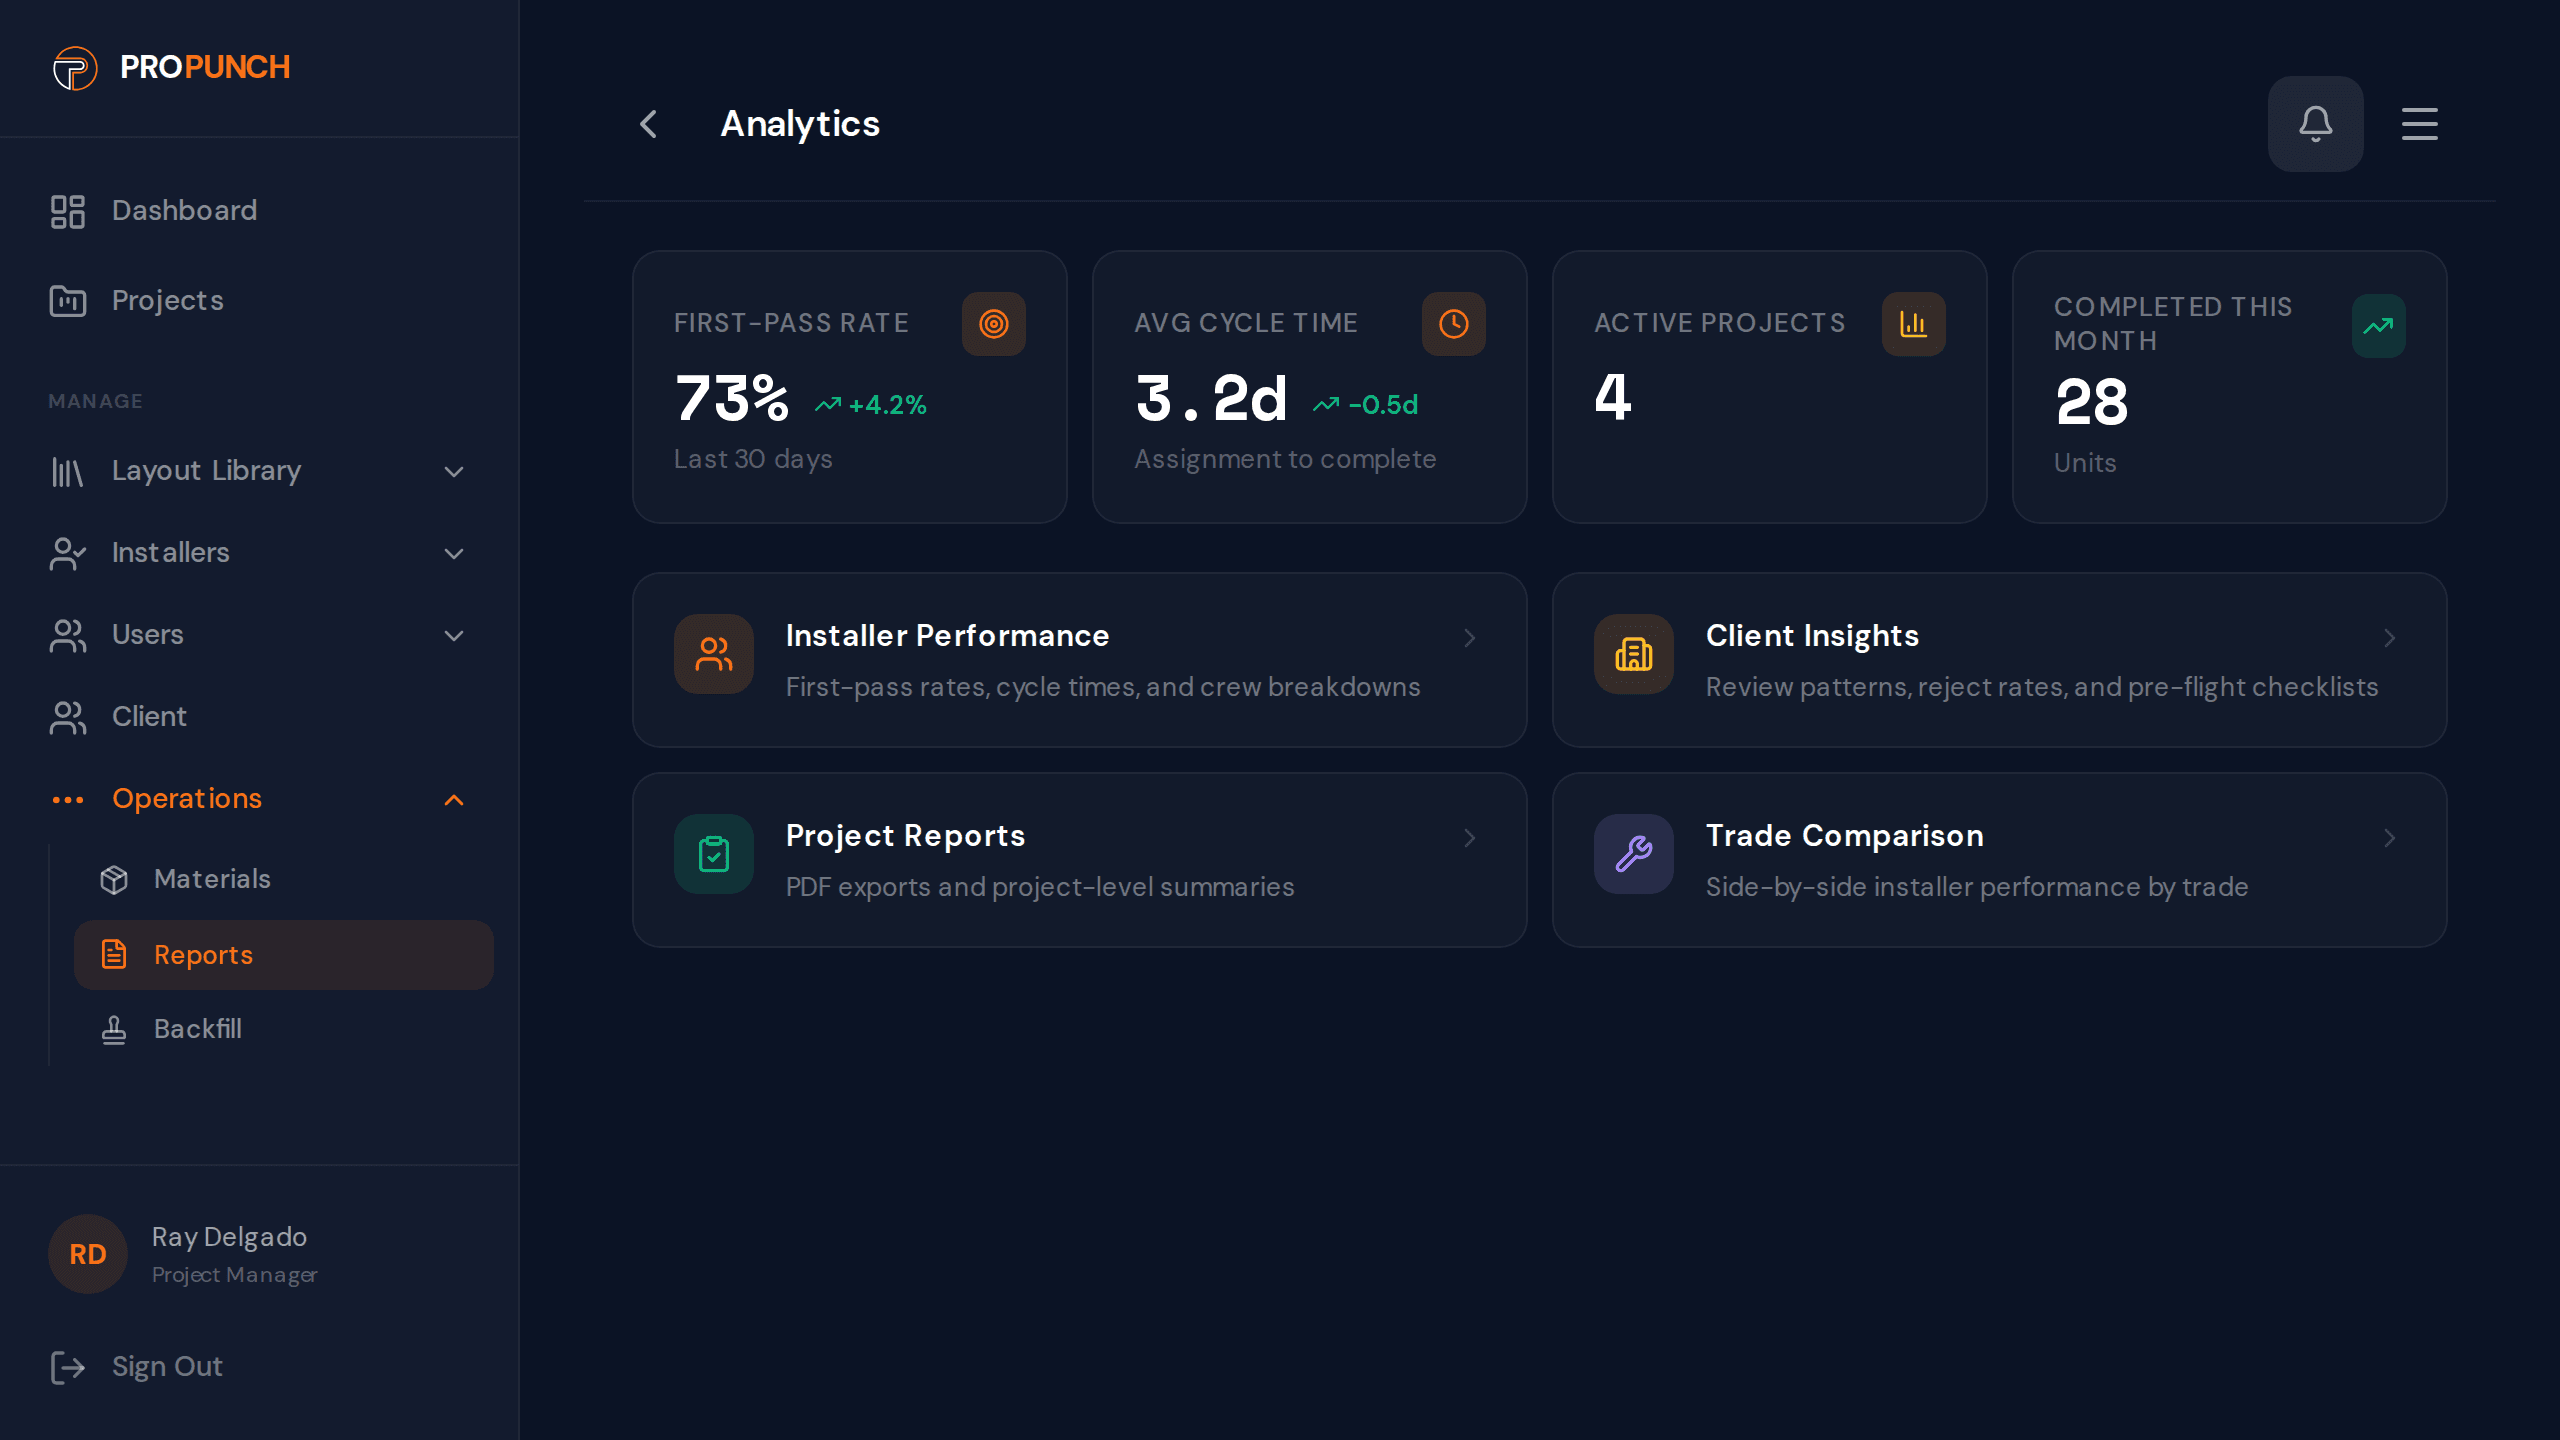
Installer Performance
First-pass rates by installer company. Which companies complete work without PM rejections? Which ones generate the most fix cycles?
Client Activity
Review velocity by client. How fast are clients signing off? Where are the bottlenecks in the approval chain?
Reports that write themselves.
Generate PDF reports for any project — unit status summaries, completion percentages, installer performance. Share with clients, present to management, attach to invoices. One tap.
Countertops running behind? Flooring companies averaging more fix cycles? ProPunch breaks down performance by trade across all your projects so you can spot patterns and make better assignments.
See performance by trade, not just by company.
A structured record of construction quality that doesn't exist anywhere else.
Every verified door writes a labeled outcome — which items failed, by trade, by crew, by floorplan, with the video evidence, the timestamps, the fix cycles, and the signed result. From 1,500+ verified checkpoints across 105 reviewed units, that already yields first-pass benchmarks, fix-turnaround times, and trade-level defect patterns. It is not self-reported logs and it is not unstructured photos — it is ground truth, and it compounds with every door.